Your Agent Latency Budget in Production Is Mostly Not the Model
Your agent latency budget in production is mostly not the model. NVIDIA built an entire CPU generation around that claim. Here is how to measure the other half.
Every agent latency budget in production I have been handed starts in the same place: a table of models, their per-token costs, and their time-to-first-token. It is a clean table. It is also, in my experience, an accounting of maybe a third of the problem, and the least interesting third.
I want to describe the thing that convinced me this is not a niche complaint, because last week a chip company spent an entire product generation arguing the same point in silicon.
What did NVIDIA actually claim about agentic workloads?
At Hot Chips 2026, NVIDIA introduced Vera, a datacenter CPU it describes as purpose-built for agentic and reinforcement-learning workloads. The framing in NVIDIA's own writeup is the part worth reading twice: CPU execution is now on the critical path alongside GPU inference, because tool calls, sandboxed code, retrieval and orchestration all gate end-to-end latency, and a slow core stalls the accelerator sitting behind it.
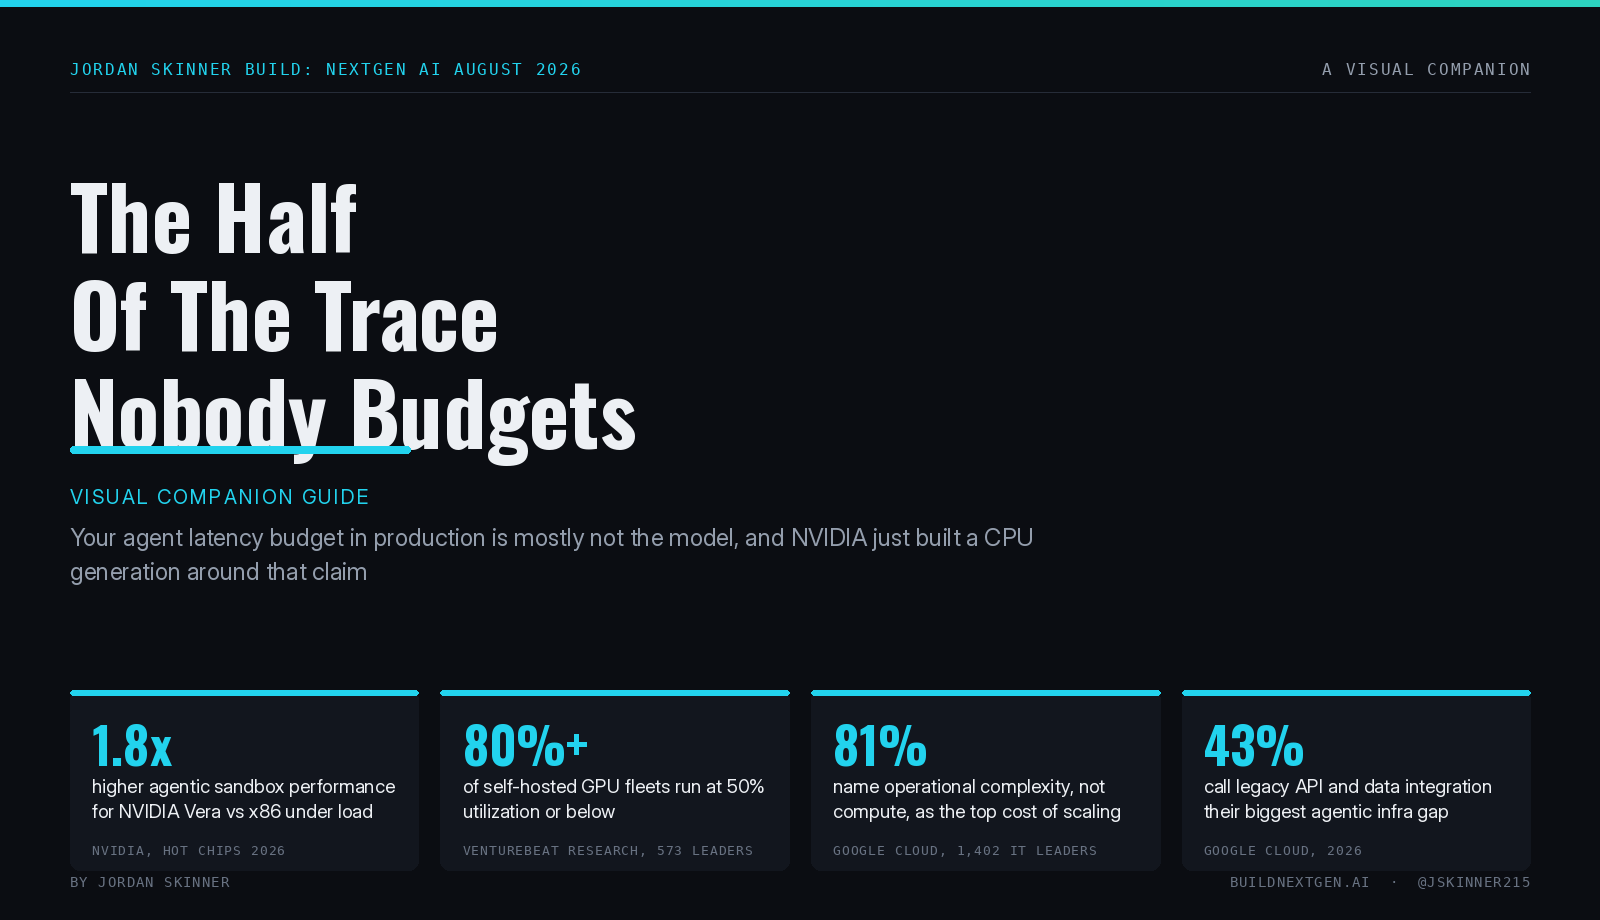
The engineering follows the claim. Vera pairs 88 custom Olympus cores with up to 1.2 TB/s of LPDDR5X bandwidth. The Olympus core targets instructions-per-cycle over core count, with a 10-wide decode front end and up to 50% higher IPC than Grace. NVIDIA chose statically partitioned spatial multithreading over conventional SMT specifically for more deterministic behavior under contention. Peak memory latency is 40% lower than x86. The headline number is more than 1.8x higher agentic sandbox performance than x86 under load, measured across code compilation, code analysis and Python workloads.
And then there is the metric change, which I think is the real argument. NVIDIA is telling datacenter buyers to stop evaluating CPUs on cores per dollar and start evaluating them on tokens per dollar. That is a claim about where the time goes.
You do not have to accept a vendor's benchmark to take the architecture seriously. Nobody redesigns a decode front end and swaps out SMT because of a rounding error. Somebody looked hard at agent traces and concluded the bottleneck had moved.
Why does this mismatch show up as idle GPUs?
Here is the corroboration I find harder to argue with, because it comes from the buyers rather than the seller.
VentureBeat Research surveyed 573 enterprise leaders this summer and found that more than 80% of organizations running self-hosted GPUs are at 50% utilization or below, and that only 44% rigorously track what their AI compute actually costs. Google Cloud's State of AI Infrastructure report, drawing on 1,402 IT leaders, found 83% saying they need infrastructure upgrades before they can support production-grade agentic AI, and 81% naming operational complexity and engineering overhead as the top unforeseen cost of scaling.
Read those together. Expensive accelerators sitting half idle is exactly the signature you would expect if the wall clock were dominated by work that never reaches them. A fleet that is compute-starved looks busy. A fleet that is waiting on a sandbox to boot, a legacy API to answer, or a vector store to return looks like this.
I am not claiming those surveys prove the thesis. Utilization is low for boring reasons too, including overprovisioning and bad scheduling. But if your mental model is that agents are a GPU problem, that number should bother you, and the cheapest way to find out whether it should is to go look at one trace.
The Trace Split
This is the only framework in this piece, and it is deliberately small, because the work is in the looking rather than in the taxonomy.
Take one production agent. Not a benchmark, not a demo, and not your simplest workflow. Take the one that costs you the most or that users complain about. Pull a single complete trace of a real task, end to end, and split every span into two buckets.
Model time is anything where a token is being generated. Everything else is everything else: the tool call and the service behind it, sandbox or container startup, retrieval, serialization and deserialization between hops, the orchestration decision about what to do next, queueing, retries, and the waiting.
Then compute one number: what fraction of the wall clock is model time.
I keep expecting this to be uninteresting and it never is. The reaction I get most often is not disagreement, it is surprise that nobody had asked. Teams building agentic frameworks for Fortune-level enterprise clients are frequently running dashboards that report token counts and model latency with real precision, next to spans for everything else that are either coarse or entirely missing. You cannot optimize what you did not instrument, and the instrumentation follows the mental model.
Two things usually fall out of the split immediately.
The first is that the largest single line item is often a tool call to something old. Google Cloud's respondents put integration with legacy APIs and data sources at the top of their agentic infrastructure gaps, at 43%. That is not a model problem and no model swap touches it.
The second is that per-step overheads that look trivial in isolation are not trivial after multiplication. A step that adds 300ms of non-model work is a rounding error in a chatbot. In a twelve-step agent that retries twice, it is most of the user's patience. This is the compounding NVIDIA is pointing at, and it is why they went after single-thread latency and determinism under contention rather than core count.
Can you even benchmark this properly?
Mostly not, with what is on the shelf, and this is worth knowing before you go looking for numbers to compare against.
Agentic control flow is nondeterministic. The same task takes a different path on two runs, which makes run-to-run comparison close to meaningless and is why serving benchmarks tuned for chat traffic mislead when you point them at agents. A recent framework called XPerf (arXiv 2608.20370) addresses this directly by replaying fine-grained traces captured from real agentic applications, so that the same workload can be run reproducibly across serving systems. It ships eight agentic applications spanning coding, deep research and QA, and the authors say they will open-source it.
The reason I mention it is not that you should adopt it tomorrow. It is that the tooling gap is itself evidence. If measuring agentic serving performance required a new methodology, the workload is not the one the existing tools were built for.
There is a parallel result on the reliability side that points the same way. Microsoft's AutoSaddler (arXiv 2608.23041) treats the agent harness as code and patches it automatically from failure traces, gaining 9.0, 9.6 and 10.0 percentage points on GAIA2, SWE-Bench Pro and Terminal-Bench 2.0 respectively. No model changed. The gains came from the scaffolding.
Latency and reliability are both being decided in the layer around the model. That is starting to look less like two findings and more like one.
What I would actually do this quarter
Four things, in this order, and the first one is free.
Run the Trace Split on one agent and write the ratio on a wall. If model time is under half your wall clock, you now know that your model-selection roadmap is a plan for the minority of your latency.
Instrument the non-model spans to the same standard you already hold model calls to. Tool call duration by tool, sandbox cold start, retrieval, serialization, queue wait. Most teams find this is a week of work and that it changes the next quarter's priorities.
Attack cold starts and per-hop overhead before you attack the model. Warm pools, connection reuse, cutting a hop out of the graph, and caching a retrieval are unglamorous and they multiply across every step of every run.
Bring the ratio to your infrastructure conversations. When a vendor shows you tokens per dollar or per-core throughput for agentic workloads, you will have your own number to hold the claim against, which is a much better position than taking the benchmark on faith.
The uncomfortable version of all this is short. We spent three years optimizing the part of the system that is easy to see, and the industry's compute roadmap has now moved on ahead of most enterprise instrumentation. Go split one trace. It is an afternoon, and it will tell you whether the last year of your latency work was aimed at the right half.
Related: Evaluating AI Agents in Production on measuring the things that actually break, The Boring Layer on the infrastructure that decides whether agents ship, and Multi-Agent Orchestration Architecture for how the orchestration layer fits together.
Sources: NVIDIA Developer Blog and ServeTheHome on Vera at Hot Chips 2026; VentureBeat Research (573 enterprise leaders); Google Cloud State of AI Infrastructure (1,402 IT leaders); arXiv 2608.20370 (XPerf); arXiv 2608.23041 (AutoSaddler).
I write one of these every week on Build: NextGen AI. Subscribe and the next one comes to you.
This post is part of the pillar guide on deploying AI agents in production, which covers the four properties a pilot never tests.